 |
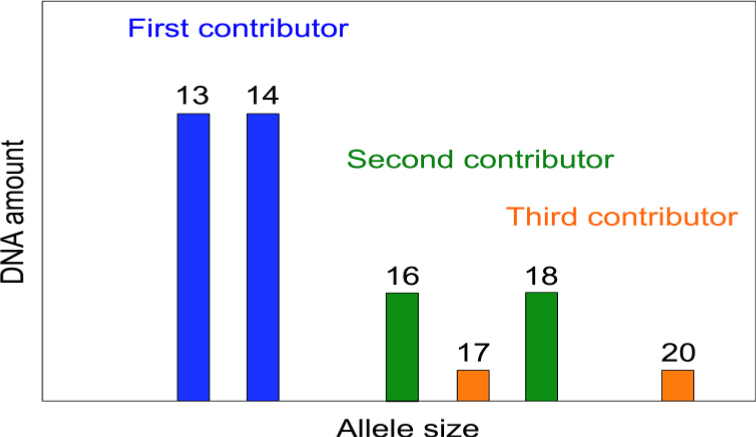
| Figure 1: DNA mixture genotypes. The data schematic shows DNA amount (y-axis) versus allele size (x-axis) at an STR locus. Each contributor is shown in a different color (blue, green, orange). The allele pair of each contributor genotype is indicated by size location (x-axis), while the relative genotype amount is indicated by bar height (y-axis). |