 |
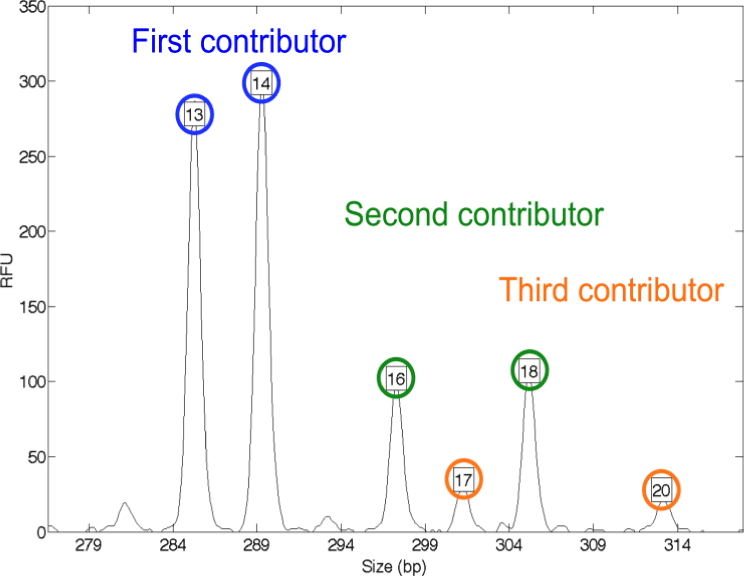
| Figure 2: Good DNA evidence data. The electrophoretogram (EPG) data trace for this three contributor mixture shows one data peak for each allele. The x-axis gives allele size (in base pairs), while the y-axis measures peak heights on a relative fluorescence unit (RFU) scale. The allele pair for each genotype (blue, green, orange) has peaks with comparable heights. Each contributor corresponds to a genotype shown in Figure 1. |