 |
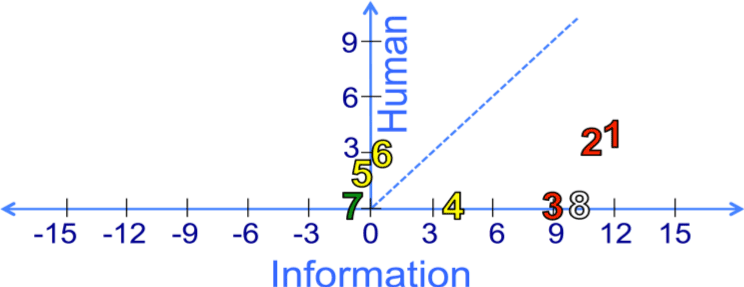
| Figure 5: TrueAllele vs. human interpretation. This scatterplot compares human match results (y-axis) versus the true computer-determined match information (x-axis). Both axes express the logarithm (i.e., order of magnitude) of a match statistic. Each number refers to a case described in the Results section. The cases are color coded as homicide (red), rape (yellow), weapon (green) and exculpatory (white). The 45° blue dashed iso-information line is where the scatterplot points would reside if human and computer methods produced the same DNA match statistic. |