 |
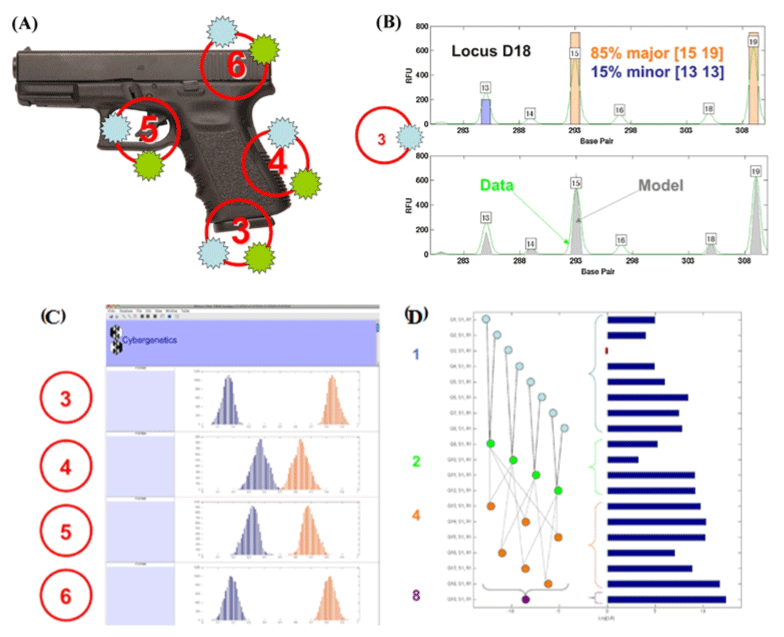
| Figure 2: (A) A handgun swabbed in four locations (marked as 3, 4, 5 and 6 in circles), each amplified twice (stars). (B) Likelihood function, showing mixture data and genotype model. (C) DNA mixture weights for the four swabs. (D) DNA log (LR) match information, increasing as more data are combined together. (Reprinted with permission from Ref. [65]; Copyright 2011 Elsevier Ireland Ltd.) |