 |
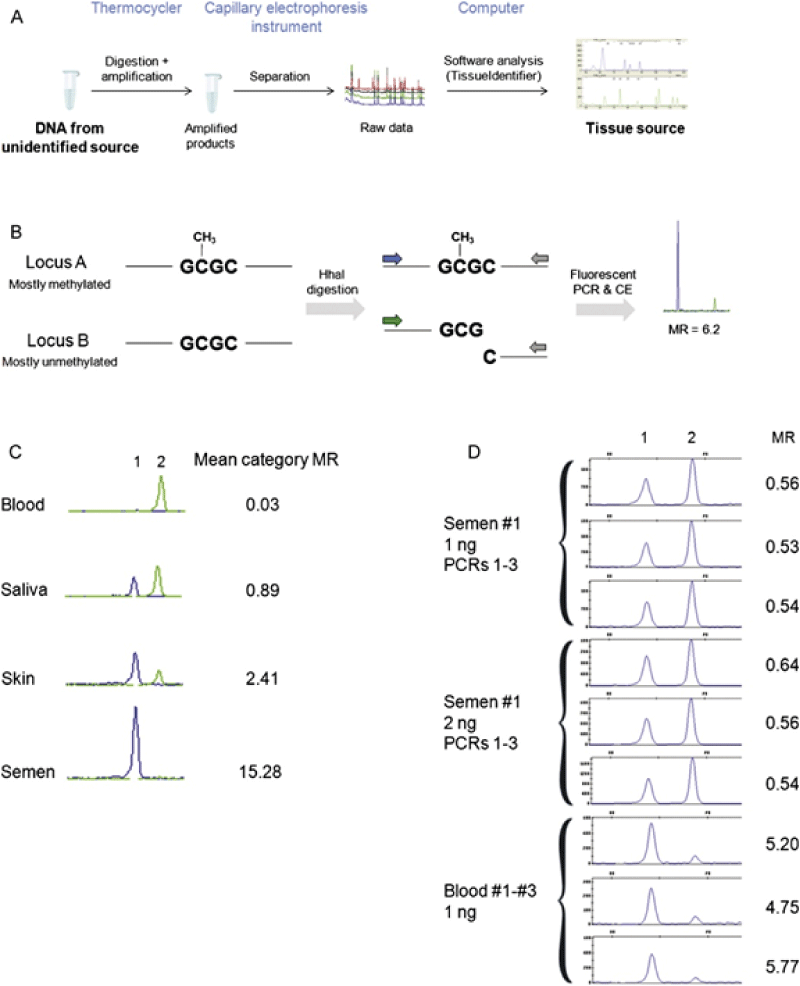
| Figure 3: (A) Schematic of tissue identification by DNA methylation analysis. (B) Biochemical principle of the assay: methylated loci remain intact during digestion and subsequently are amplified efficiently in the PCR, producing a strong signal (locus A) while unmethylated loci are digested and subsequently amplify inefficiently in the PCR, producing a weak signal (locus B). The methylation ratio (MR; signal intensities of locus A/rfu of locus B) reflects the differential methylation level between loci A and B. (C) MRs between locus 1and locus 2 are different in blood, saliva, skin, and semen, reflecting the differential methylation patterns in these tissues. (D) The observed differences in MRs between blood and semen (i.e. the signal) are more than a magnitude greater than the observed differences in MRs obtained from different PCRs and from different amounts of input DNA (i.e. the noise).(Reprinted with permission from Ref. [75]; Copyright 2011 Elsevier Ireland Ltd.) |