 |
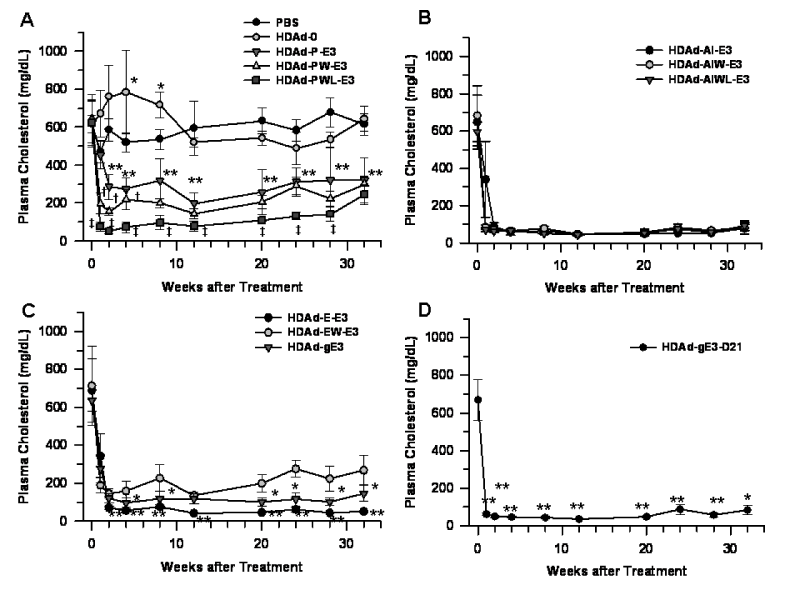
| Figure 3: Plasma cholesterol levels. Six to eight week old Apoe−/− mice received i.v. injection of 5 x 10¹² v.p./kg of HDAd expressing apoE3 and plasma cholesterol was measured over the following 32 weeks. A. PEPCK expression cassette. *p<0.05 vs. PBS, **p<0.001 vs. PBS, †p<0.01 vs. HDAd-P-E3, ‡p<0.05 vs. HDAd-P-E3 and HDAd-PW-E3. All time points in the HDAd-PW-E3 and HDAd-PWL-E3 groups were significantly different from the PBS group after vector treatment (p<0.001), but not indicated. B. APOAI expression cassette. p<0.001 vs. PBS, group, except in the HDAd-AI-E3 group 1 week after treatment. There was no statistical significance among treatment groups. C. APOE expression cassette. Plasma cholesterol levels in all treatment groups were significantly lower than those in the PBS group (p<0.001) except 1 week after treatment in the HDAd-E-E3 and HDAd-ghE3 groups. *p<0.05 vs. HDAd-EW-E3. **p<0.01 vs. HDAd-EW-E3 and HDAd-gE3. D. Plasma cholesterol levels in mice treated with HDAd-gE3 on pΔ21 backbone. *p<0.05 vs. HDAd-gE3, **p<0.01 vs. HDAd-gE3. n=5/group. |