 |
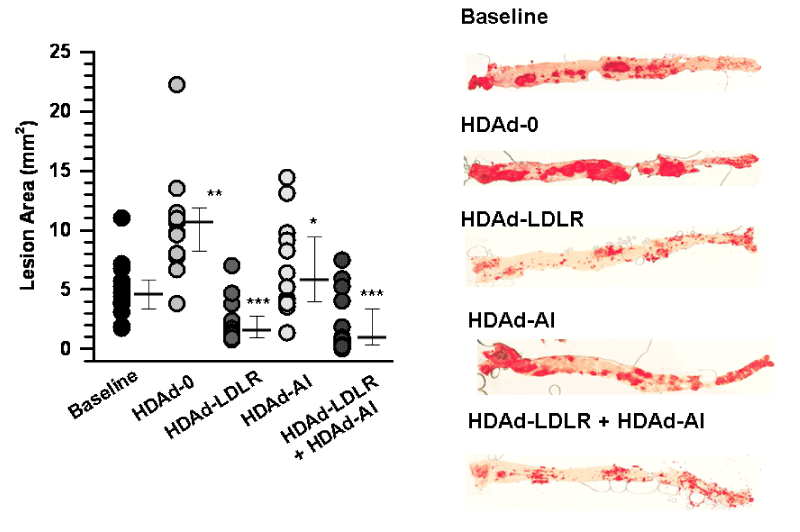
| Figure 8: LDLR gene therapy induces regression of advanced atherosclerosis. A. En face quantification of aortic lesions. Atherosclerotic lesions were stained with Oil Red-O and quantified by morphometric analysis. Data were analyzed by Mann-Whitney Rank Sum Test. Median, 25th percentile and 75th percentile values are indicated. *p<0.05 (vs. HDAd-0), **p<0.001 (vs. baseline), ***p<0.001 (vs. baseline, HDAd-0, HDAd-AI). n=13 (baseline), 13 (HDAd-0), 14 (HDAd-LDLR), 12 (HDAd-AI), and 15 (HDAd-LDLR + HDAd-AI). Representative staining of aortas is shown in right panel. |