 |
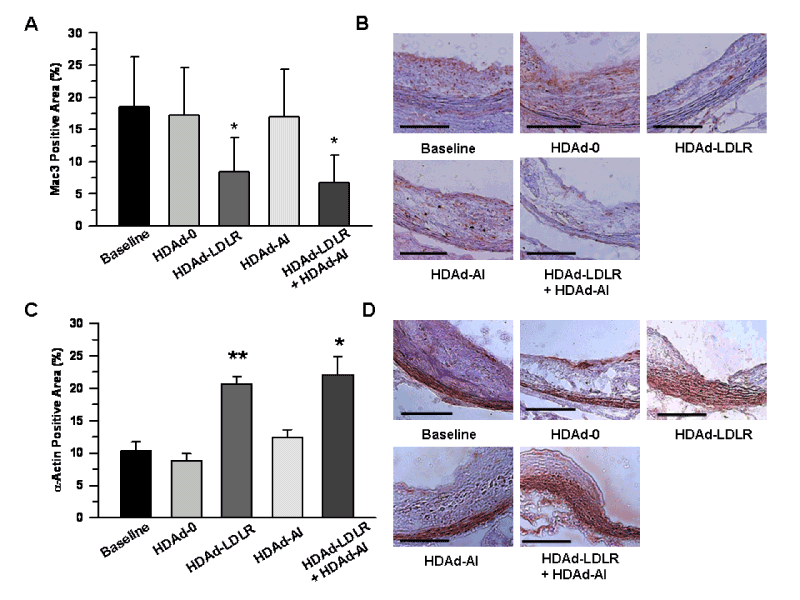
| Figure 9: Immunological features in atherosclerotic lesions. A. Mac3 (macrophage) staining. *p<0.01 vs. baseline, HDAd-0 and HDAd-AI. Data are presented as mean ± SD. n=5/group. B. Representative Mac3 immunoreactivity in cross-section of aorta 28 weeks after treatment. Bar, 100 μm. C. Relative α-actin immuno positive areas. *p<0.01 vs. baseline and HDAd-0, and p<0.05 vs. HDAd-AI. **p<0.001 vs. baseline, HDAd-0 and HDAd-AI. n=4 (baseline), 3 (HDAd-0), 4 (HDAd-LDLR), 4 (HDAd-AI) and 4 (HDAd-LDLR+HDAd-AI). D. Representative α-actin immuno staining. Bar, 100 μm. |