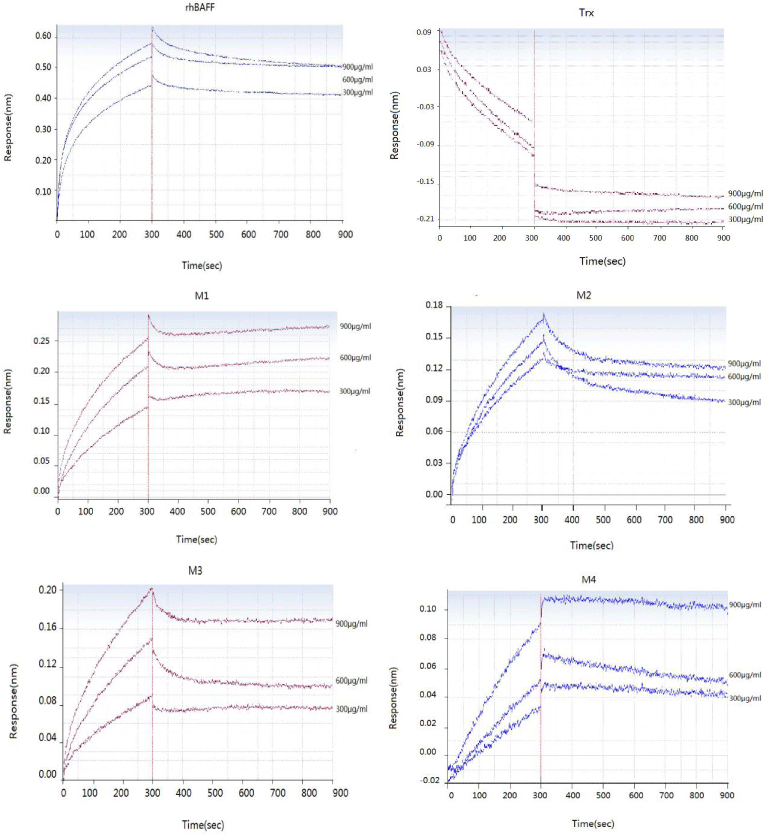
Trx 、rhBAFF 、M1 、M2 、M3 and M4 (Figure 2).
 |
| Figure 3: The kinetic activity measurement of TACI and BAFF or its doman
mutant. Affinity measurement on the sensor surface using ForteBio: cruve of
the experimental data corresponding to phases of association and dissociation
of proteins (Trx, rhBAFF, rhCBAFF mutants) at various concentrations on the
TACI-Ig anchored to the sensor chip. Starting from the bottom the protein
concentrations are: 900, 600, 300 μg/mL. These curves were used to determine
KD, Kon and Koff. Trx 、rhBAFF 、M1 、M2 、M3 and M4 (Figure 2). |