|
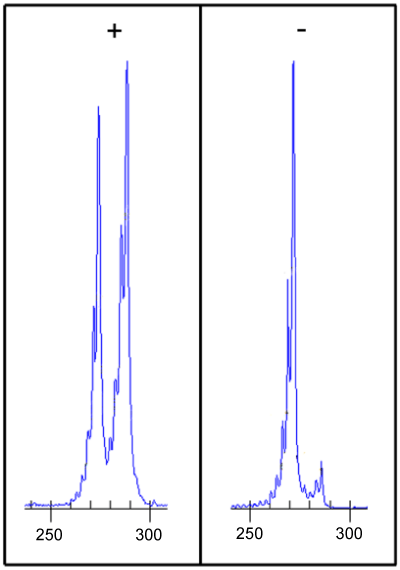
| Figure 3: XCI in the case report. In the non-digested sample (on the left), the 2 alleles had different numbers of CAG repeats, while in the digested sample (on the right) only 1 peak is present, indicating a pattern of extremely skewed inactivation (100:0). |