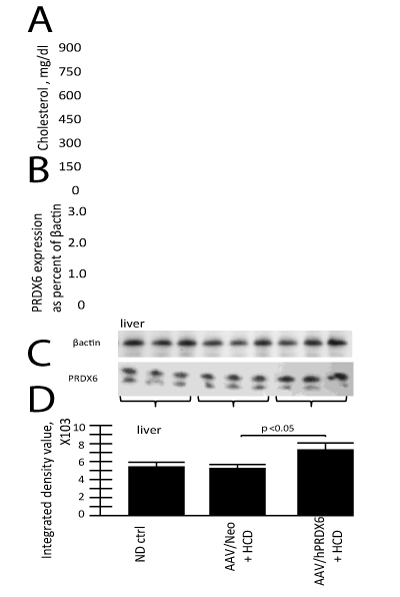
A. shows the levels of total plasma cholesterol.
B. shows relative expression of hPRDX6 gene to that of βactin by real-time quantitative PCR from aorta of 3 mice in each group. For qRT-PCR the quantity of RNA for each gene was normalized to βactin in the same sample. Data shown are mean +/- SE.
C. shows the total mPRDX6 and hPRDX6 protein levels (post-translationally modified and unmodified) in the livers of the indicated animal groups compared to βactin levels, and the pRDX6 levels are quantified in
D. The key at the bottom is used for all panels. (HCD: High Cholesterol Diet).