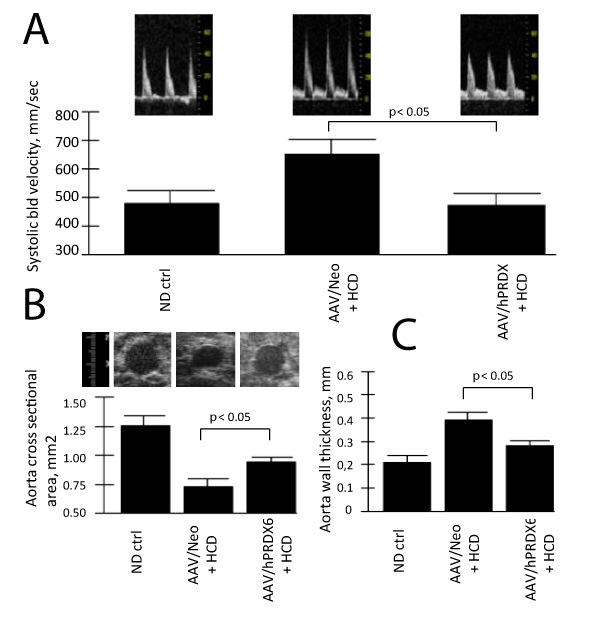
Figure 2: Aortic structure with hPRDX6-gene delivery shows less HCD-induced
remodeling. High resolution ultrasound (HRUS) was used to measure various
aortic parameters.
A. shows quantification of blood flow velocities in the luminal center of the
abdominal region of the aorta in 3-5 animals in the indicated treatment after 20
weeks on HCD. Representative capture images from the analysis are shown
just above. Note that the AAV/hPRDX6-HCD animals have significantly lower
systolic blood velocity than the AAV/Neo-HCD animals.
B. shows quantification of the cross-sectional area of the thoracic region of
the aorta in 3-5 animals from each animal group by HRUS with representative
captured images from the analysis. Note that the AAV/hPRDX6-HCD animals
have a significantly larger cross sectional area than the AAV/Neo-HCD animals,
indicating significant efficacy.
C. shows quantification of the wall thickness of thoracic region of the aorta.
Note that the AAV/hPRDX6-HCD animals have a thinner wall thickness than
the AAV/Neo-HCD animals. |