 |
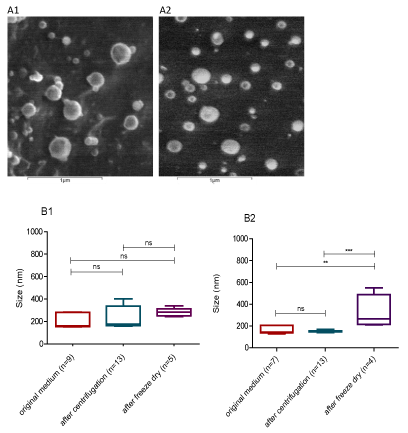
| Figure 1: A) Nanoparticles observed by CryoSEM after a 48 hours dialysis against water. (A1) Chitosan/PCL nanoparticles; (A2) PCL nanoparticles. Length of scale bar: 1 μm. B) Particles size distribution on the original medium and after re-suspension in water after two different isolation procedures. Box and whiskers graphics showing maximum, minimum, median and 75th and 25th percentiles (ns: no statistical difference; ** p<0.05; *** p<0.01). (B1) Chitosan/ PCL particles; (B2) PCL particles. |