 |
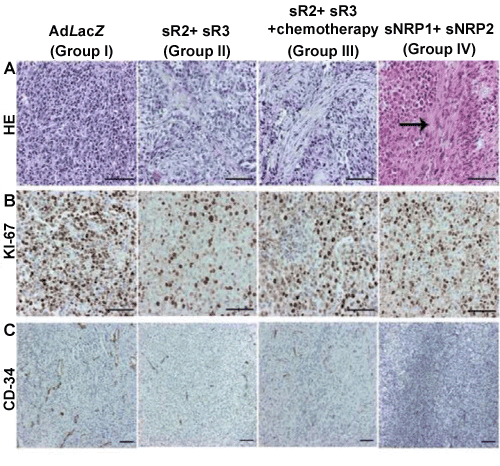
| Figure 4: Histology of intraperitoneal ovarian cancer tumors. a) Hematoxylin-eosin staining of poorly differentiated high grade serous adenocarcinoma in control group I and treatment groups II, III and IV. Fibrosis (arrow) was most clearly seen in tumors in group IV. b) In KI-67 staining more proliferating tumor cells were noted in control group I compared to groups II (p=0.002) and III (p=0.002). c) CD-34 positive microvessels in tumor tissues of groups I, II, III and IV. In control group I total vascular area (TVA) was significantly higher than in treatment groups II (p=0.005), III (p=0.003) or IV (p=0.013). Magnification, × 200 (a-d); × 100 (e, f). Bar=200 μm or 100 μm. |