![]() |
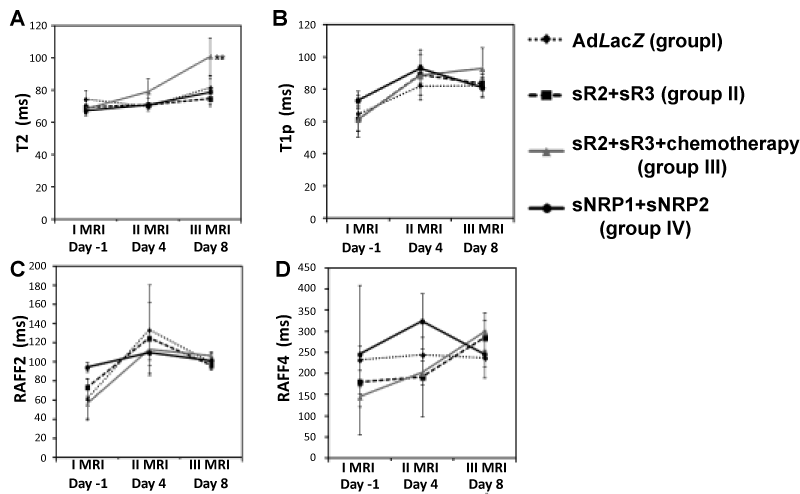
Figure 5: Treatment responses evaluated with relaxation times T2, T1ρ, TRAFF2 and TRAFF4 in ovarian cancer tumors at MRI days -1, 4 and 8. a) T2 relaxation times are
significantly longer in combination gene therapy and chemotherapy group III at day 8 (**p < 0.01) compared with the control group I. b) T1ρ relaxation times relaxation times were increased simultaneously by the day 4 in all groups. c) TRAFF2 and d) TRAFF4 were longer at day 8 compared to levels at the beginning. In other than T2 relaxation times no significant differences between the treatment groups were noticed. Error bars= SEM. |