 |
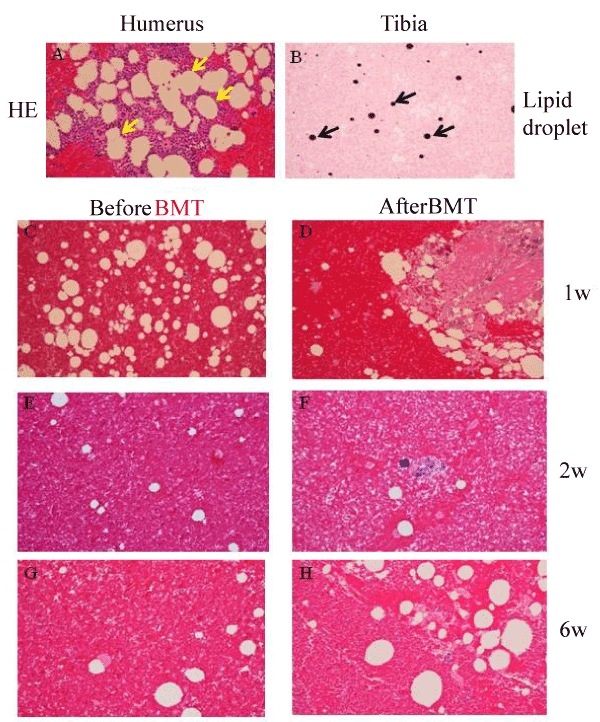
| Figure 4: Histological examination of clot sections. Figure 4A. HE staining in humeri of monkeys. Many adipocytes were observed (arrows). Figure 4B Lipid droplets (blown color) were observed in the tibias (arrows). Figure 4C, 4E and 4G. HE staining in the tibias before BMT. Figure 4D, 4F and 4H. HE staining in the same tibias 1, 2 and 6 wks after BMT, respectively. Scale bar =50μm. |