 |
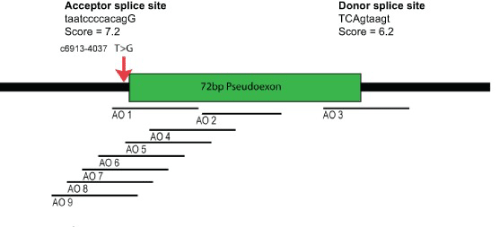
| Figure 2: AO binding sites in relation to the pseudo-exon. The pseudo-exon is shown in green and the black bars represent flanking intronic sequences. The location of the mutation is indicated by the red arrow. The acceptor and donor splice site sequences and scores are shown. AOs are shown to scale. |