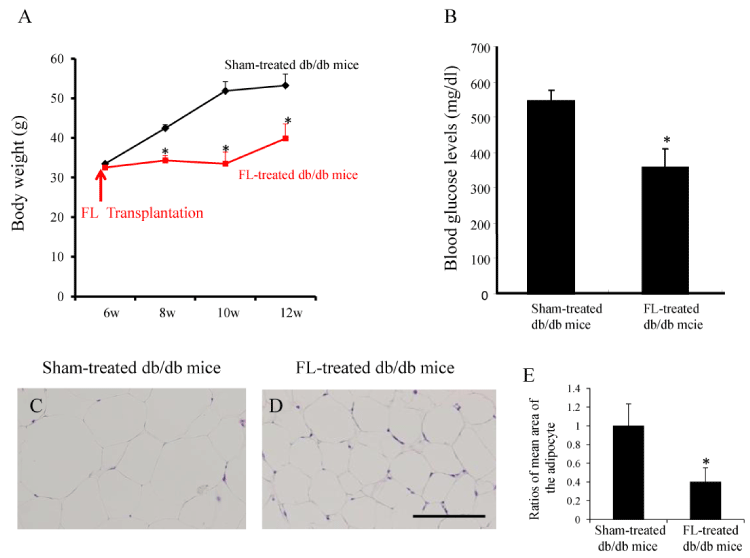
(A) Body weights (*p<0.05). (B) Fasting blood glucose levels (*p<0.05). (C and D) HE staining in the Visceral fat. (E) Analysis of adipocyte size in the FL-treated and sham-treated db/db mice. The mean area of a single adipocyte cell was significantly lower in the FL-treated db/db mice than in the sham-treated db/db mice. The results are mean ±SD, n=6 in each group