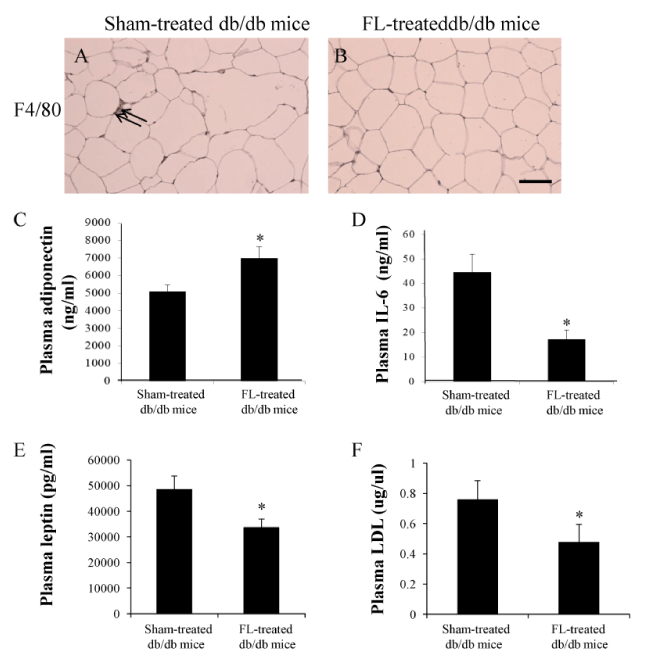
(A and B) F4/80 staining in the visceral fat. (C) Plasma adiponectin levels (*p<0.05) (D) Plasma IL-6 levels (*p<0.05). (E) Plasma leptin levels (*p<0.01) (D) Plasma LDL levels (*p<0.05). The results are mean ±SD, n=6 in each group. Scale bar =25μm
 |
| Figure 3: Imaging Analysis of Adipose Tissue and Cytokines (A and B) F4/80 staining in the visceral fat. (C) Plasma adiponectin levels (*p<0.05) (D) Plasma IL-6 levels (*p<0.05). (E) Plasma leptin levels (*p<0.01) (D) Plasma LDL levels (*p<0.05). The results are mean ±SD, n=6 in each group. Scale bar =25μm |