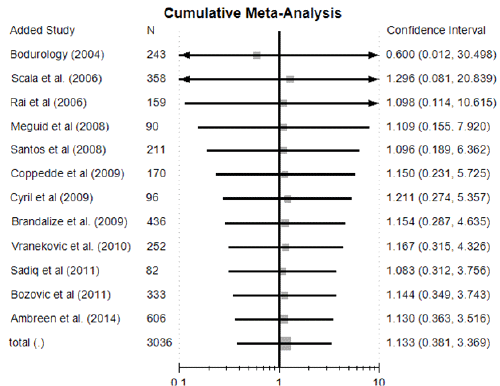
Figure 2:
Forest plot of ORs showing AA+AC when compared to the CC genotype. The squares and horizontal lines correspond to the study-specific OR and 95% CI.The area of the squares reflects the study-specific weight [15-23,28-30].