 |
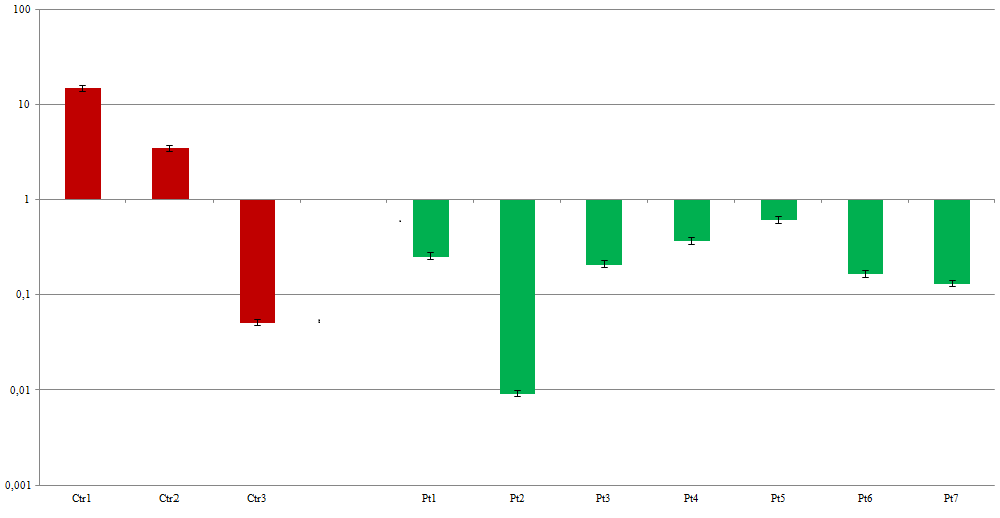
| Figure 1: Mir-483-3p/5p ratio (log scale) in tissue samples. MiR-483-3p levels are higher than those observed for miR-483-5p in control Ctr1 and Ctr2 RNAs. Conversely in Ctr 3(non–neoplastic part of Pt4) and in HB patients (Pt1-Pt7) this ratio is inversed. |