|
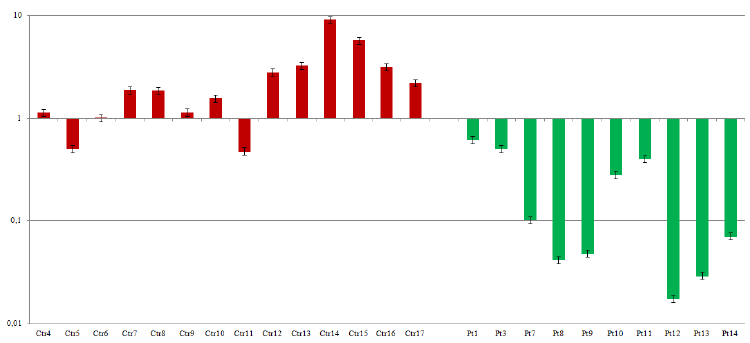
| Figure 2: Mir-483-3p/5p ratio (log scale) in serum samples. MiR-483-5p form levels are higher than -3p ones when compared to controls; viceversa, in control samples the miR-483-3p form is predominant. In Ctr5 and Ctr11 an inversion in the pattern of the ratios was observed. |