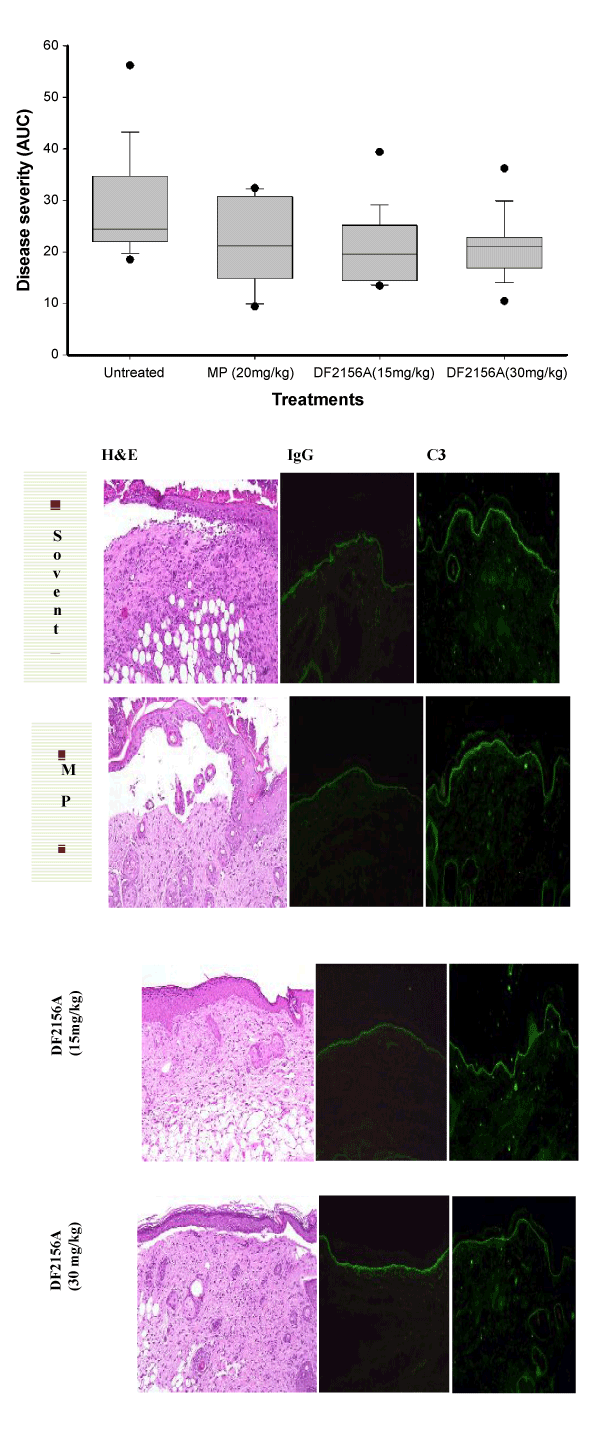
A. Overall disease severity, expressed as the area under the curve (AUC), in the indicated treatment groups: untreated (saline), n=17; DF2156A (15 mg/kg), n=18; DF2156A (30 mg/kg), n=16; methylprednisolone (MP), n=10. Due to the non-parametric distribution of the numbers, data is presented as median (black line), 75-percentile (box) and 95-percentile (error bars). Numbers beyond the 95-percentile are indicated as dots. *indicates statistic significance (ANOVA on Ranks followed by Dunn’s Method for multiple comparisons versus untreated).
B. Representative H&E-stained sections as well as IgG and C3 deposition at the dermal-epidermal junction by direct immunofluorescence microscopy (counterstained with DAPI) 12 days after first IgG injection. Scale bars at the bottom indicate the original magnification.