|
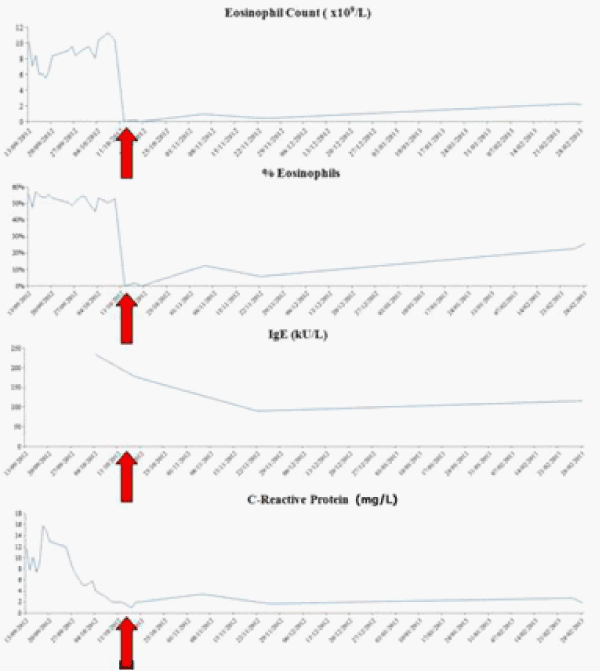
| Figure 5: Graphs demonstrating the response to treatment of peripheral blood eosinophil count (x109/L), percentage eosinophils (%), IgE levels (kU/L) and C-Reactive Protein levels (mg/L). Red arrows indicate initiation of corticosteroid treatment. Note values trend upwards as corticosteroid therapy is weaned. |