 |
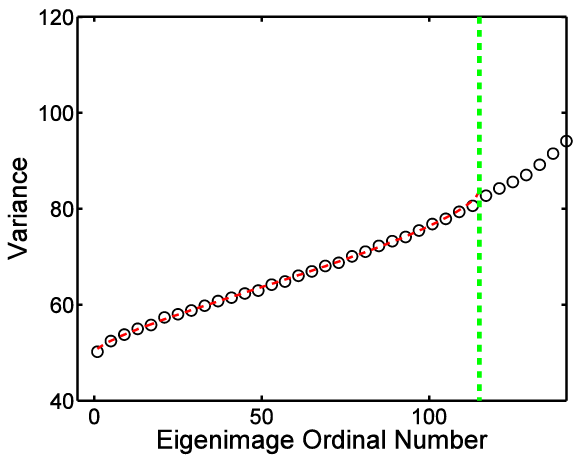
| Figure 4: The mean noise variance measured in the first 148 eigenmodes in real-time cardiac MR cine image series, and first 115 eigenmodes were identified as noise-only. The dashed line indicates the theoretical prediction of Equation (A.2), ○ represents the experimental result. The vertical dotted line indicates the cutoff between noise-only eigenmodes and signal dominated eigenmodes. |