 |
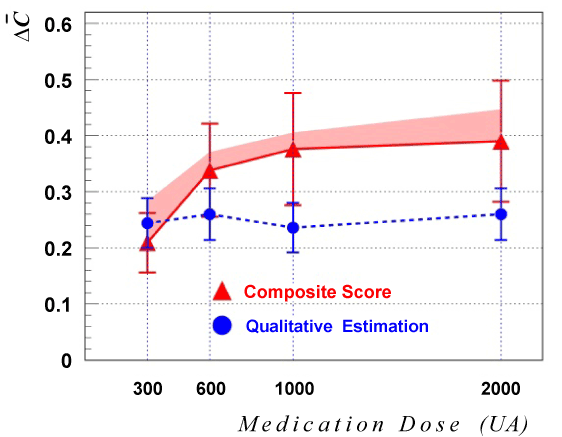
| Figure 1: Therapeutic effect (ΔC), calculated by Equations 1-3 for four patients groups, each of which was treated with one of the medication doses M1-M4 is shown by triangles, connected with solid line. Error bars represent statistical errors of the mean. The dots connected with dashed line represent the qualitative estimation of the therapeutic effect for patients with improved symptoms. Error bars represent a square root of number of patients in the corresponding dose group. |