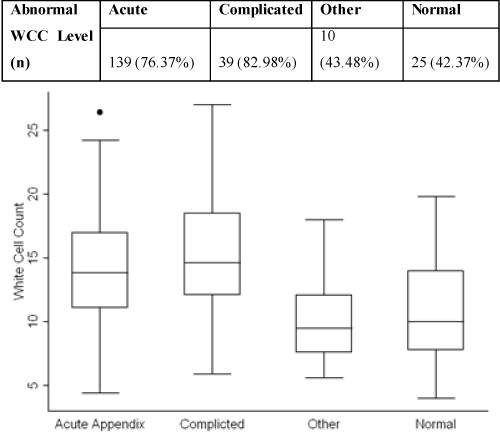
indicating the minimum, maximum and mean values of WCC for each
subgroup with 95% confidence limits. The figure demonstrates a raised WCC
for both acute and complicated appendicitis.
|
| Figure 2: Abnormal WCC levels and Appendicitis box and whisker plot indicating the minimum, maximum and mean values of WCC for each subgroup with 95% confidence limits. The figure demonstrates a raised WCC for both acute and complicated appendicitis. |