|
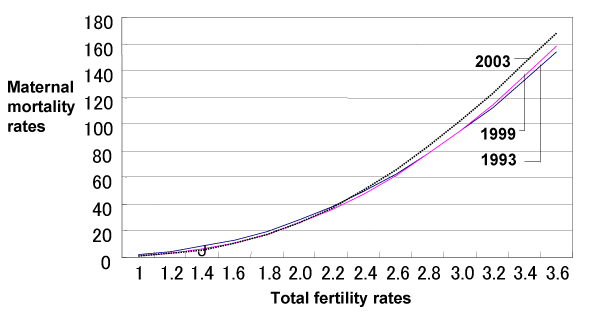
| Figure 3: Maternal mortality rate (Y axis) of a country was higher than 100 when the total fertility rate (X axis) was more than 3 in the world. The regression curves were obtained by the processing of UNICEF data [1]. Regression equation in 2003: Y=-2.48X2+5.31X+0.04, where Y=Log maternal mortality, X=Log total fertility rate, R2=0.8, p<0.001. J: Maternal mortality in Japan in 2008. |