 |
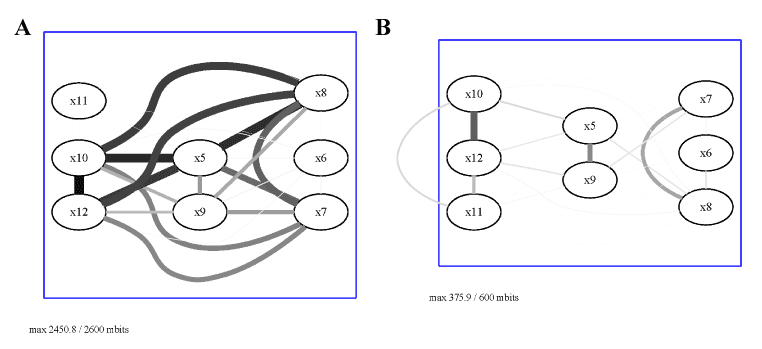
| Figure 3: Contrasting DWIGs using marginal and conditional MI for the insulin data. (A) Marginal DWIG, with maximum divergence set to 2600mbits. (B) conditional DWIG with maximum set to 600mbits. The edge width and gray scale are linearly related to the divergence, the millibit measure of edge strength. The maximum width and tone are user-defined. The unit used in the display is millibits. There are 28 edges in both graphs corresponding to all pairs of the 8 variables, but their visibility depends on their strength relative to the set maximum. The actual conditional MIs measured in millibits used to calculate the weights for B are reported in adjacency Table of DWIG in the supplementary data. |