 |
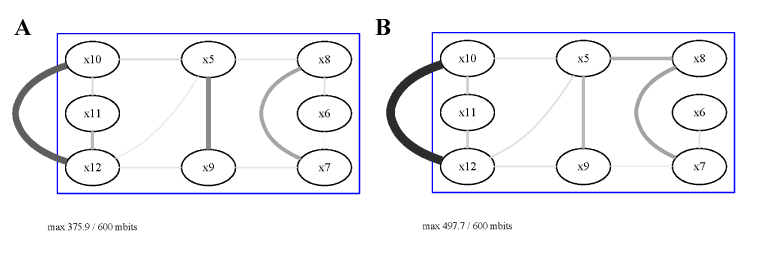
| Figure 4: The thresholded sample DWIG and the DWIG of the fitted model for the insulin data. (A) The thresholded sample DWIG. (B) The conditional DWIG of the fitted model defined by thresholding. Both graphs display conditional MIs. The graphs are very similar, with just the weight on the edges relating x10 - x12, x5 - x9 and x5 - x12 differing. |