 |
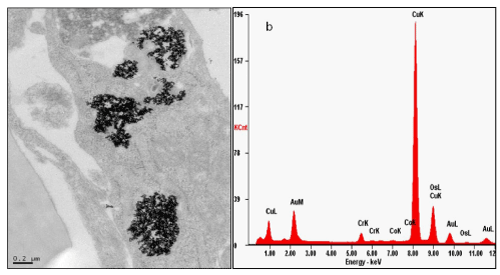
| Figure 6: High resolution images showing large clusters of AuNPs within the cytoplasm of MC3T3 cells exposed to 160 µg/ml of AuNPs (a) The corresponding XEDS spectrum collected from intracellular AuNPs clusters is shown (b) The Cu signal is provided by the holder used for the microscopy analysis. |