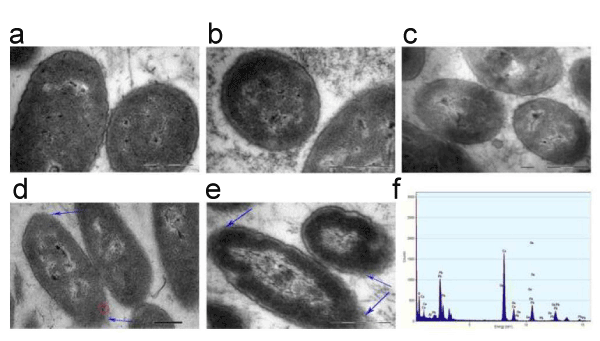
a-c) In the control group (a, 0 mmol/L) and bulk alumina groups (b, 5 mmol/L; c, 50 mmol/L), the cell membranes are distinct, and the cytoplasm is compact; d and e) the cell membranes of bacteria, which were treated with different concentrations of nano-alumina (d, 5 mmol/L; e, 50 mmol/L) were damaged (indicated with blue arrows), and the extent of damage increased with increasing concentrations of nano-alumina. There were also many highly dense particles in cells (red astragal zone); f) the composition of chemical elements in the bacterial red astragal zone. Scale bars: 500 nm.