|
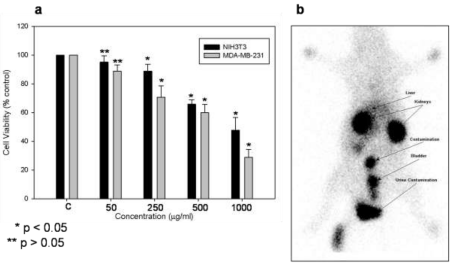
| Figure 6: a) Cell viability assay of gold nanoparticles against NIH3T3 mouse embryonic fibroblast cell line and MDA-MB-231 human breast carcinoma cell line. The data represented in the form of a bar graph and plotted using means + S.E. of triplicate determinations. The values were analyzed by Student’s t-test (p<0.005), statistical analysis, P values for significantly different means, *P<0.05 and **P>0.05 vs control, b) Gamma scintigraphic image showing biodistribution of biosynthesized gold nanoparticles in rat. |