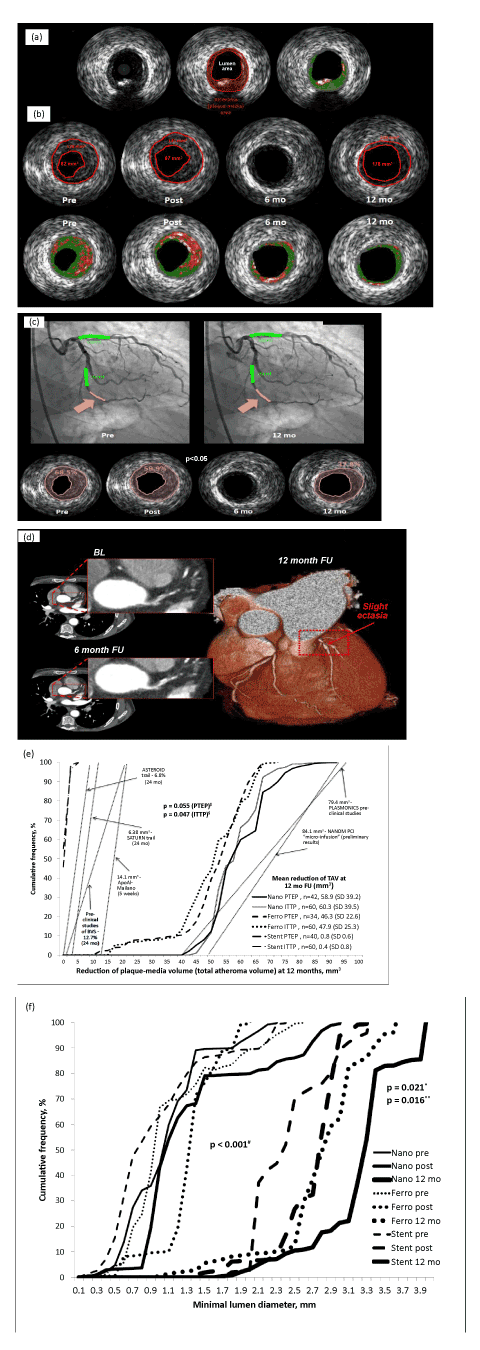
* - p value for the difference between Nano group and Ferro group
** - p value for the Nano group and stenting control
# - p value for the comparison between pre- and post-procedure values
 * - p value for the difference between Nano group and Ferro group ** - p value for the Nano group and stenting control # - p value for the comparison between pre- and post-procedure values |
| Figure 3: Imaging results of the NANOM FIM trial. Panel (a) shows methodology of IVUS measurements. The cross-section for analysis is identified. External elastic membrane (EEM) and boundary of lumen are marked by red lines. Atheroma (plaque media) area is planimetered as a product of subtraction of the cross-sectional area of the lumen from the area of the EEM. Panel (b) documents an example of atheroma regression with grey-scale and virtual histology IVUS analysis pre-, postprocedure, at 6 and 12 month follow-up in case of the micro-bubbles infusion with incorporated NP. Red lines indicate EEM and luminal boundary of the vessel wall. The atheroma area decreased from 178 to 108 mm3 with proportional changes in the lumen area. Panel (c) depicts QCA pre-procedure and at 12 month follow up with relevant dynamics of plaque burden in IVUS frames below. A rose-marked layer of the artery wall shows boundaries of the lesion with per cent atheroma volume pre-, post-procedure and 12 month follow-up. Panel (d) shows multi-slice CT scan frames of LAD at baseline, 6- and 12 month follow-up in patient D. treated with intracoronary infusion of micro-bubbles. Panel (e) depicts cumulative frequency distribution curves of the mean reduction of plaque burden at 12 month follow-up in comparison with historical data of ABSORB, SATURN, ASTEROID, NANOM-PCI, PLASMONICS, and Apo-AI Milano studies. |