|
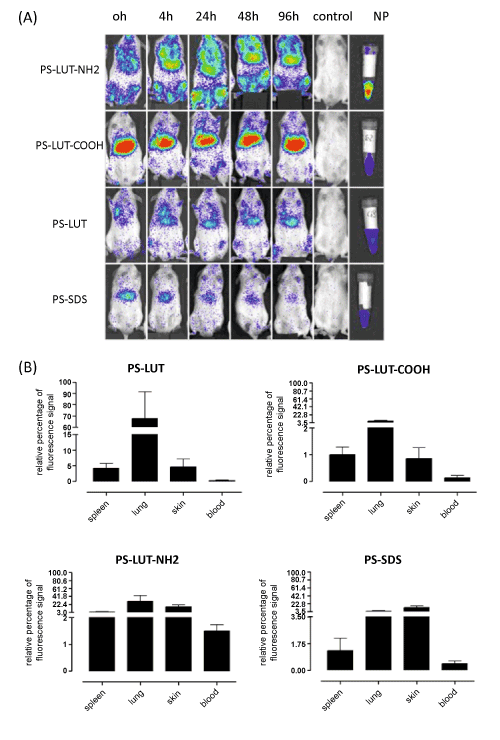
| Figure 7: Biodistribution of NPs in NSG mice: (a) 37 μg•mL-1 were applied intravenously with measurement of fluorescence signals (relative values in relation to liver-fluorescence) at different time points. On the very right side of every figure is the control displayed, that received no particles. (b) Quantitative analysis of fluorescence signals in diverse organs and tissues, 96 h after NPs application. The organ-specific fluorescence was calculated as percentage of liver-fluorescence (liver is set as 100%, mean with SEM). PS-LUT n= 4, PSLUT- COOH n= 4, PS-LUT-NH2 n= 5, PS-SDS n= 3. |