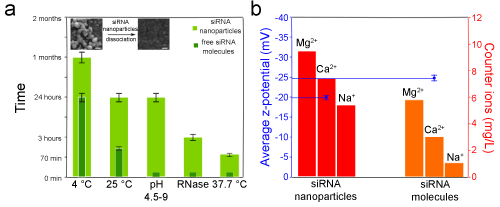
molecules as a function of temperature (4°C, 25°C and 37°C), pH changes
(from 4,5 to 9) and presence of RNases in solution. HRSEM images of siRNA
nanoparticles before and after dissociation are shown at the top part of the
graph. Scale bars=100 nm; (b) chart summarizing average zeta-potential (in
mV) and counter ions concentrations (mg/L) for nanoparticulate siRNA and
free siRNA molecules.