 |
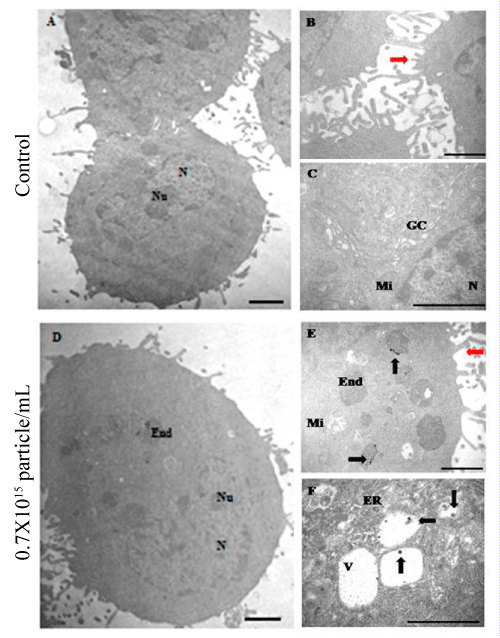
| Figure 4: TEM images of the UM-SCC14A cell line. (A-C) Control cells without MNP-incubation and (D-F) cells incubated with 0.7×10¹⁵ particle/ mL for 24 hours. Scale bars represent 500 nm. Black arrows indicate MNPs internalized by eletrolucid vesicles or eletrodense vesicles in the cytoplasm. Red arrows indicate projections of the plasma membrane. GC: Golgi complex. End: eletrodense endosome. ER: endoplasmatic reticulum. Mi: mitochondria. N: nucleus. Nu: nucleolus. V: eletrolucid autophagic vacuole. |