 |
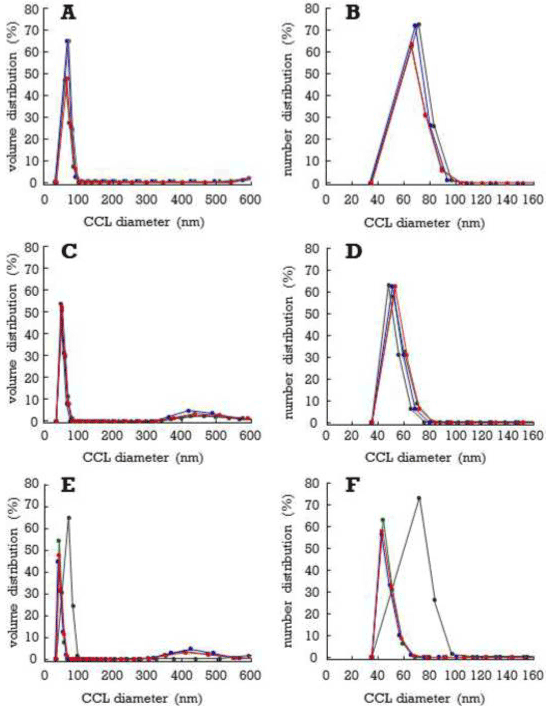
| Figure 4: Long-term stability of CCL. Size distribution plot by volume (A, C, E) and by number (B, D, F) of CCL prepared with different lecithin/chitosan ratios (w/w), namely: 5 (A, B), 10 (C, D) and 20 (E, F). Measurement were performed immediately after preparation (red line) and after 15 (green line), 30 (blue line) and 60 days (grey line). |