|
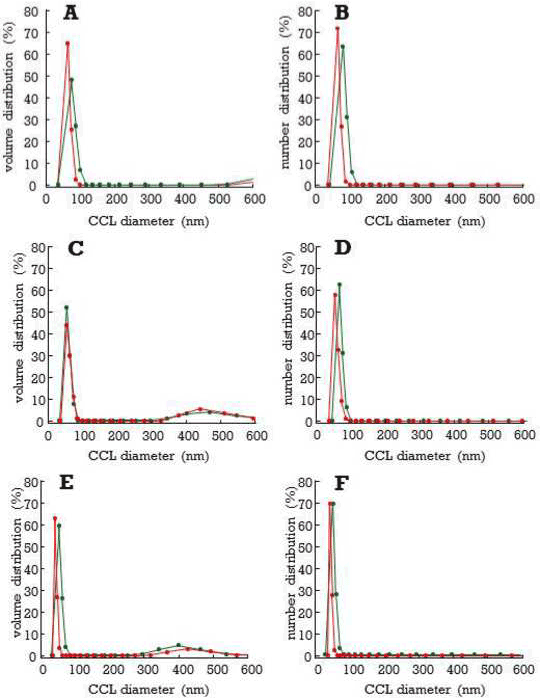
| Figure 5: Size distribution comparison between empty and CF loaded CCL. Size distribution plot by volume (A, C, E) and by number (B, D, F) of empty (red line) and CF loaded CCL (green line) prepared with different lecithin/ chitosan ratios (w/w), namely: 5 (A, B), 10 (C, D) and 20 (E, F). Size distribution comparison between empty and CF loaded CCL. Size distribution plot by volume (A, C, E) and by number (B, D, F) of empty (red line) and CF loaded CCL (green line) prepared with different lecithin/chitosan ratios (w/w), namely: 5 (A, B), 10 (C, D) and 20 (E, F). |