 |
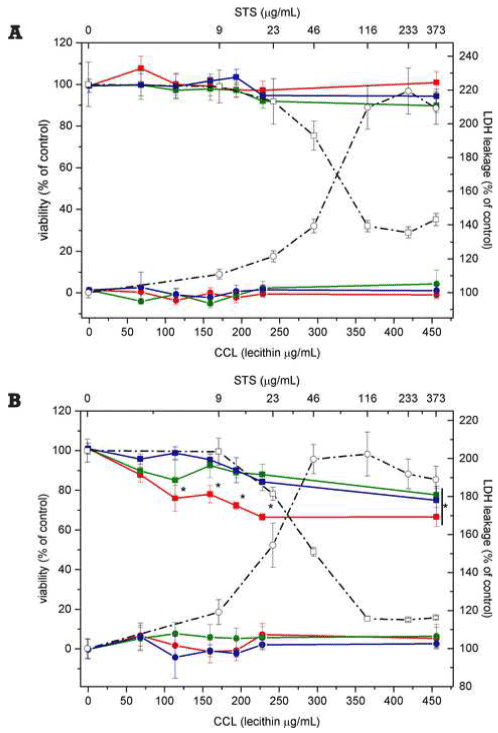
| Figure 7: Cytotoxicity on A549 cells. Viability (squares) and membrane integrity (circles) assays of A549 cells exposed to increasing CCL concentrations (CCL-R5 red line, CCL-R10 green line, CCL-R20 blue line) for 24 h (A) and 48 h (B). Positive control curves obtained with STS (dash-dot black lines) are reported. (*P<0.05). Results are shown as mean ± standard deviation of 3 independent experiments. |