 |
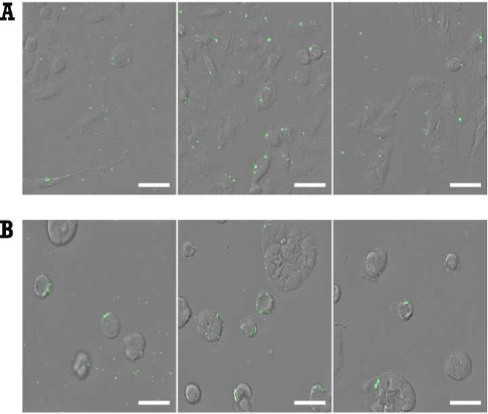
| Figure 9: CCL interactions with A549 and Caco-2 cells. Representative confocal laser scanning microscopy images of CF loaded CCL after 30 minutes of incubation. A549 cells (A) and Caco-2 cells (B) exposed to CCL with lecithin/ chitosan ratios of 5 (left), 10 (center) and 20 (right). Images are the overlay of fluorescence and transmitted light (DIC) signals. Scale bar indicates 50 μm. |