|
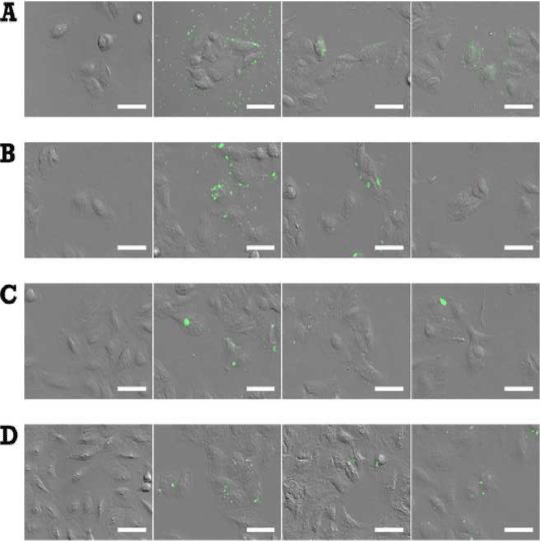
| Figure 10: CCL interactions with A549 cells at increasing incubation times. Representative fluorescence images of A549 cells with CF loaded CCL at increasing incubation time. Incubation times of 30 min (A), 2 h (B), 6 h (C) and 24 h (D) are shown. Rows show from left to right untreated cells (left) and cells treated with CCL-R5, CCL-R10 and CCL-R20. Fluorescence signals are overlaid on transmitted light (DIC) images. Scale bar indicates 50 μm. |