|
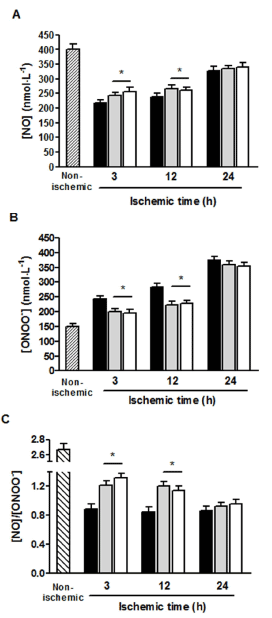
| Figure 4: Calcium ionophore (1 μM)-stimulated maximal NO (A) and maximal ONOO- (B) release (maximal amperogram amplitude) from isolated brain tissues of SD rats treated with vehicle (closed bars), simvastatin (20 mg·kg-1 daily for 14 days, gray bars) or atorvastatin (10 mg·kg-1 daily for 14 days, open bars). Brain slides were obtained after 3 h, 12 h and 24 h of pMCAO. The concentration of NO and ONOO- represent maximum production from cNOS (eNOS and nNOS). C is the ratio of maximal NO to maximal ONOO- concentrations of the above corresponding groups. *P< 0.05 vs. vehicle-pretreated group. |