 |
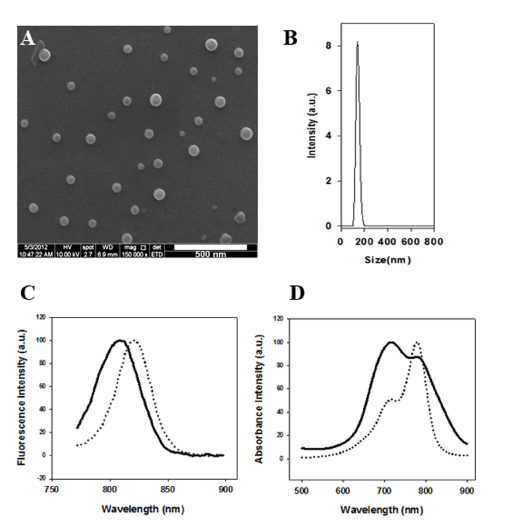
| Figure 7: Characterization of the NIR fluorescent P(EF-PLLA) nanoparticles. A, B: SEM image and hydrodynamic size histogram of the NIR fluorescent P(EF-PLLA) nanoparticles, respectively; C,D: emission and absorbance spectra of free ICG (dotted lines) and nanoparticles containing ICG (solid lines), respectively. |