 |
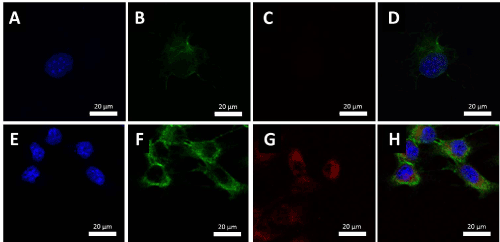
| Figure 3: Confocal fluorescent photomicroscopy of control 4T1 cells (Sections A, B, C, D); and Lipo-AlClPc (5 µM) (red fluorescence) cellular uptake after 30 minutes of dark exposure (E, F, G, H). Subsections A/E; B/F; C/G; D/H represent, respectively, nuclear staining (Hoescht - blue fluorescent); actin filament staining (Alexa - green fluorescent); AlClPc (red fluorescent); and overlap of the previous fluorescences. |