 |
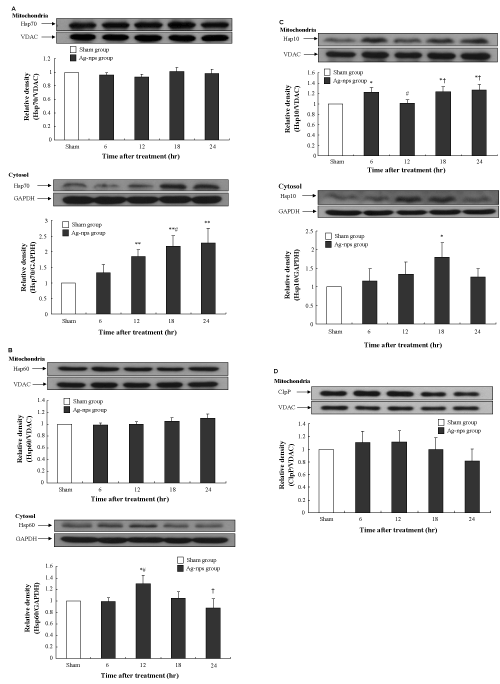
| Figure 3: Expression of Hsp70, Hsp60, Hsp10 and ClpP were observed in rat liver following Ag-nps administration. Upper panels show the representative immunoblots of molecular chaperones Hsp70 (A), Hsp60 (B), Hsp10 (C) and protease ClpP (D) in mitochondrial and cytosolic fractions while lower panels depict densitometric analysis of immunoblots. Experiments were carried out as described under Materials and Methods. The VDAC and GAPDH were used as mitochondria and cytosolic markers, respectively. Values were means ± SD (n=8). *p<0.05 and **p<0.01 versus sham group; #p<0.05 versus 6hr group;†p< 0.05 versus 12 hr group. |