 |
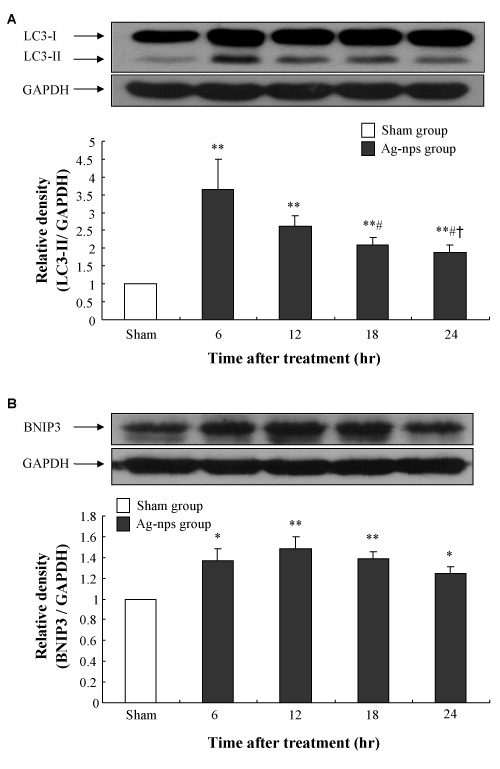
| Figure 5: Changes in LC3-II (autophagy marker) and BNIP3 (mitophagy marker) protein expression in rat liver at different time points after i.p. injection of Ag-nps. Upper images show the representative immunoblots of autophagy marker LC3-II (A) and mitophagy marker BNIP3 (B) in liver tissues while lower images depict densitometric analyses of immunoblots. GAPDH gene was used as an internal loading control. Values were means ± SD (n=8), *p<0.05 and **p<0.01 versus sham group; #p<0.05 versus 6 hr group; †p<0.05 versus 12 hr group. |