|
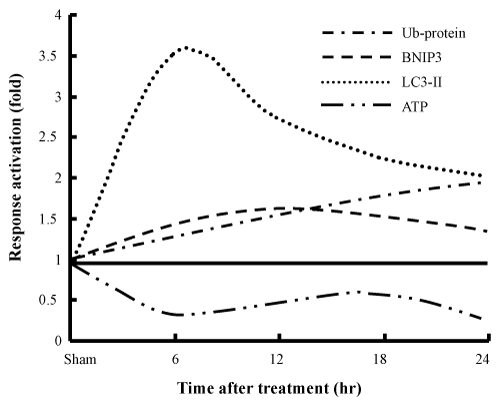
| Figure 6: Interrelationships among changes in Ub-proteins, autophagy/ mitophagy markers and ATP content in rat livers as a function of time following Ag-nps administration. Data in Figures 1, 2 and 5 were used and replotted as a function of time following Ag-nps administration. |