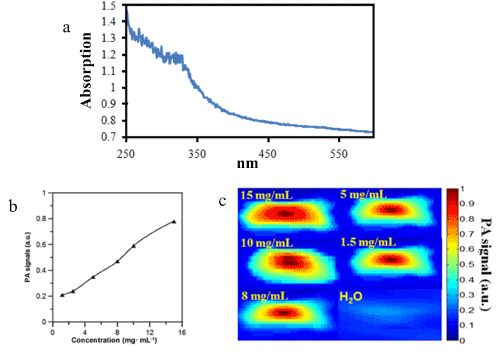
Figure 4:
(a) UV-vis spectrum of poly(AMPD-BAC)-g-PEG-DTPA-Pt. (b) PA signals of a series of different concentration of poly(AMPD-BAC)-g-PEG-DTPA-Pt and water. (c) False color images representing the relative PA signal strengths PA B-scan.