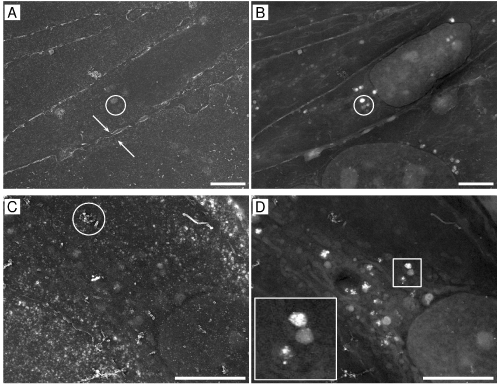
A) Secondary electron image of the PBCEC. The arrows mark the border of two cells. The cell network can clearly be identified. Scale bar: 5 μm. B) Backscattered electron image of the same region as in A). The circle in A) and B) highlights vesicles which appear as bright spots in the BSE image due to the high density of membranes which are stained by osmium tetroxide. In the SE image the vesicles are hardly visible since the SE signal is surface sensitive. In contrast to a), the internal structures of the cell can be visualized by the BSE signal. Scale bar: 5 μm. C) SE image of PBCEC incubated with AgEO-NPs for 6 h. The circle frames an area were membrane bound nanoparticles are visible. Such events are found frequently all over the specimen. Scale bar: 4 μm. D) BSE image of the same region as in C). The inset shows a close up of an empty vesicle and two vesicles filled with nanoparticles. Scale bar: 4 μm. In all images the contrast and brightness was rescaled in order to improve the visualization of the cell organelles.